Revised market lot of F&O

NIFTY 50 25
CNXMDCAP 150 75
ASHOKLEY 11000 8000
AXISBANK 1250 500
GMRINFRA 10000 9000
HAVELLS 1250 1000
IFCI 9000 8000
NHPC 12000 10000
UNITECH 17000 9000
—————————————–
ADANIENT 1000 500
ADANIPORTS 2000 1000
ALBK 4000 2000
AMBUJACEM 2000 1000
ARVIND 2000 1000
AUROPHARMA 500 250
BANKBARODA 500 250
BHARATFORG 1000 250
BHARTIARTL 1000 500
BHEL 2000 1000
CENTURYTEX 1000 500
CIPLA 1000 500
COLPAL 250 125
CROMPGREAV 2000 1000
DABUR 2000 1000
DISHTV 8000 4000
DIVISLAB 250 125
FEDERALBNK 4000 2000
GAIL 1000 500
HCLTECH 250 125
HDFCBANK 500 250
HDIL 8000 4000
HINDPETRO 1000 500
IGL 1000 500
INDIACEM 4000 2000
IOB 8000 4000
IRB 4000 1000
KOTAKBANK 500 250
MOTHERSUMI 1000 500
ONGC 1000 500
ORIENTBANK 2000 1000
PFC 2000 1000
PNB 500 250
RANBAXY 1000 500
RELCAPITAL 1000 500
SIEMENS 500 250
SRTRANSFIN 500 250
SSLT 2000 1000
SUNPHARMA 500 250
SYNDIBANK 4000 2000
TATAMOTORS 1000 500
TATAMTRDVR 2000 1000
TATASTEEL 1000 500
TVSMOTOR 2000 1000
UNIONBANK 2000 1000
UPL 2000 1000
VOLTAS 2000 1000
YESBANK 1000 500
————————————–
UBL 250 500Revision of Market Lot of Derivative Contracts on Indices
NIFTY Present Market Lot 50 Revised Market lot 25
Nifty Midcap 50 Present Market Lot 150 Revised Market lot 75
All contracts in the above mentioned Indices shall have the new market lot with effect from October 31, 2014
DEPARTMENT : FUTURES & OPTIONS Download Ref No : NSE/FAOP/27733 Date : September 30, 2014
Circular Ref. No : 069/2014
*-*-*-*-*-*-*-*-*-*-*-*-*-*-*-*-*-*-*-*-*-*-*-*-*-*-*-*-*-*-*-*-*-*-*-*-*-*-*-*-*-*
Revised market lot of F&ODEPARTMENT : FUTURES & OPTIONS Download Ref No : NSE/FAOP/27734 Date : September 30, 2014
Circular Ref. No : 070/2014
INDIAVIX Present Market Lot 550 Revised Market lot 800
The revised lot size shall be applicable to contracts with expiry date October 28, 2014 and onwards

London Metal Exchange raises fees by a third

London Metal Exchange raises fees by a third
The London Metal Exchange is hiking transaction fees charged to members and users by an average of 34% for the first time since Hong Kong Exchanges & Clearing Ltd. acquired it for $2.2 billion in 2012.
The new tariff, to be charged in U.S. dollars, seeks to help fund investment in the exchange and it will come into effect on Jan. 1, Chief Executive Garry Jones said in a statement.
The move come as the LME's owner needs to invest in upgrading its system.
The LME, as was just three years ago, would not survive in today’s environment
The LME, as was just three years ago, would not survive in today’s environment,” said at a press conference in London.
The company said the new fee structure simplifies and levels out the transaction fees across the LME user base.
Charles Li, the HKEx chief executive, said the fees hike would benefit members as higher exchange revenues fed through to better trading systems and a broader range of products.
“Ultimately everybody will make a lot more money out of their participation in LME,” Li said in the statement. “The fee increase is just a rebalancing of some of that economic interest between the exchange and the members.”
Nitty-Gritty
The exchange will charge its ring members 50 cents for one side of the contract in trading and clearing fees, up from 38 cents now, according to this table. Members who lack the right to trade on the floor will pay 90 cents, compared with 58 cents.
Short-dated client carry trades will continue to attract a discount in the new fee schedule, the LME said. Members’ clients will pay 50 cents for short-term carries compared with 38 cents now, while other trades will cost 90 cents compared with 65 cents now, according to the LME. Member-to-member give-up trades will cost 50 cents, down from 58 cents now.

September precious metal price meltdown

September precious metal price meltdown
On Tuesday gold futures came under pressure again on the back of a rampant dollar which hit a four-year high against a basket of currencies of the major trading partners of the US.
In late afternoon trade on the Comex division of the New York Mercantile Exchange gold for December delivery was changing hands for $1,208 an ounce, down more than $10 an ounce or 0.8% compared to Monday's closing price.
Earlier in the day the price of the yellow metal hit $1,204, but found some support after the dollar pared its gains following disappointing data on home prices in the US released on Tuesday.
After closing 2013 at $1,205 the price of gold jumped out of the starting gate, rising consistently to reach a high of $1,380 in March.
But the subsequent retreat accelerated during the third quarter with a loss of 6.2% in September alone. September was the worst monthly performance since June 2013 when gold lost 28% over the course of the year.
Historically holding gold going into September reaps investors a more than 3% return.
The steady decline over the course month is contrary to usual trading patterns – historically holding gold going into September reaps investors a more than 3% return.

Both large investors and retail buyers seem to be abandoning the sector.
The third quarter is the sixth quarter in a row holdings in global exchange traded funds backed by physical gold have seen a reduction.
Overall gold bullion holdings are now at five year lows and a whopping 950 tonnes below the record 2,632 tonnes or 93 million ounces reached in December 2012.
On the futures market speculators have also turned decidedly bearish.
Copper was also in danger of falling through key support levels
Bullish bets on gold – net long positions held by large investors like hedge funds – fell by 20%, in the week to September 23 according to Commodity Futures Trading Commission data – the lowest point this year.

Silver futures also had a dismal day with December contracts falling to a day low of $16.85, down over 4% on the day and a more than 13% decline for the month. By late afternoon the metal had recovered somewhat to trade at $16.99, still the lowest since January 2010.
January platinum futures – the most active contract on the Nymex – briefly dropped through the $1,300 an ounce level.
The precious metal fell 8.8% in September, but sister metal palladium was the biggest loser – down nearly 15% in September. It is worst month in three years for palladium as it declined from 13-year highs at the end of August above $900 an ounce.
Copper was also in danger of falling through key support levels with December deliveries hitting a day low of just above $3.00 a pound, down nearly 5c on the day.

China Zinc Exports Hit 6-Year High in August

China Zinc Exports Hit 6-Year High in August
 China’s zinc exports reached a –year high in August, and most exports went to LME-registered warehouses, Shanghai Metals Market learns.   

China exported 21,200 tonnes of refined zinc in August, up 28-fold YoY, bringing net imports only 37,000 tonnes, according to China Customs.  

Growing pressures in bonded-zone inventories, Qingdao’s financing fraud, high storage charges and cash flow problems all promoted export activities since June, especially in bonded zones.

The SHFE/LME zinc price ratio dropped to 7.1-7.2 June-August, holding losses for imports above 1,000 Yuan/tons, preventing goods in bonded zones from entering domestic market. 

Over the past few months, major export destinations of Chinese zinc products were Taiwan (China), Malaysia, Singapore and South Korea, and all these regions have LME-approved warehouses.

Besides, LME zinc inventories have grown from 700,000 tons to 750,000 tons since June. Hence, SMM estimates that most exports went to LME-approved warehouses in Asia. 

Outbound shipments of Chinese zinc products are expected to remain high in the near future due to the current price ratio and liquidity conditions.

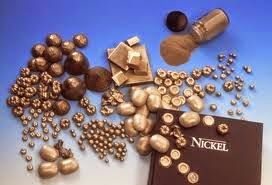
Nickel prices to average around $20,000 per mt in 2015

Nickel prices to average around $20,000 per mt in 2015
According to Carey Smith, Research Analyst, Alto Capital, LME Nickel prices are most likely to average around $20,000 per mt in 2015. The high prices are on account of the Indonesian ban on nickel ore exports and the anticipated supply shortage during early-2015. The Nickel prices are likely to trade between $17,000 per mt and $23,000 per mt during 2015. The research report also states that the prices of the metal are expected to average at $18,000 per mt during 2014.
China relies heavily on Indonesian ore exports to produce nickel pig iron. The country had approximately 30 million mt of ore stockpiles, which is soon getting depleted. The stocks are likely to hit the bottom levels by early-2015, notes Smith. As of now China buys low-grade ore from Philippines. The supply from Philippines is expected to continue further. However, China has already started construction of nickel pig iron smelters in Indonesia, the earliest of which is expected to become online towards end-2015.
The research report forecasts that Chinese ore demand may continue to grow, even as nickel pig iron production dropped during 2014. Supply tightness will keep the nickel pig iron production by the country under pressure. The country will have to reach out to new supply sources or draw out from LME stockpiles.
Nickel prices have appreciated by nearly 40% since the start of the year, when Indonesia imposed ban on ore exports. The LME nickel prices have been rangebound between $18,000 per mt and $20,000 per mt. The current prices are down by almost 18% when compared with the 2014 peak of $21,500 per mt reached in May this year.

What to expect from Base Metals market in October ?

What to expect from Base Metals market in October ?
It is a traditionally peak demand period for base metal market in September and October. However, market conditions did not get improved over the past September.

Will base metal market improve in October after high consumption failed to materialize in September?
“At the macro front, the Chinese story is not a great one for base metal market”, said an analyst from COFCO Futures, citing the sluggish property market and the lack of fresh stimulus measures.

A strengthening dollar will also put a downward pressure on base metal market, he added in SMM’s latest interview.

“Market fundamentals, however, will paint different pictures for different products”, he added.

The copper market will see supply pressures growing in response to capacity expansion and high TCs, and this will send copper prices lower, while possible supply disruptions in aluminum and zinc market will help support the two markets, the zinc market in particular.

London Metal Exchange hikes 2015 trading fees by 34 percent

London Metal Exchange hikes 2015 trading fees by 34 percent
* LME owner HKEx seeks to boost profits after 2012 takeover
* Fees to be simplified, "all-in" transaction fee in dollars
* Significant discounts on LME open-outcry trading
* Makes progress on opening warehouses in China
 

The London Metal Exchange (LME) hiked trading fees for 2015 by 34 percent on Monday as its owner moved to boost profit from the world's biggest industrial metals market after a costly takeover.
 
The 137-year-old LME had warned of hefty increases after years of operating as a member-owned market that kept a lid on trading fees, but the average rise turned out to be significantly less than some members had feared.
 
The LME also said in a statement it would provide an
 
"all-in" transaction fee in a single currency, the U.S. dollar.
 
The hikes are another major step by the LME's owner, Hong Kong Exchanges and Clearing Ltd, to increase revenue after splashing out $2.2 billion to buy the exchange, a price that analysts said was very expensive.
 
"The new LME tariff is competitive and ensures we can continue focusing on innovation and offering users the highest levels of service," said Garry Jones, LME chief executive and HKEx co-head of global markets.
 
HKEx has invested hundreds of millions of pounds into the LME to modernise it, make it more competitive and due to increased regulation, Jones told a news conference. "The LME as was, just three years ago, would not survive in today's environment."
 
The new tariff structure includes a significant discount on
 
"ring" trading after the LME said in June it would keep open-outcry trading, bucking a trend by most other markets to shift to all-electronic operations. 
 
The LME said clearing fees will remain unchanged, a week after the exchange launched it own clearing house, LME Clear. 
 
"Members understand that we will have a much better exchange providing much higher quality of services, product capability, regional expansion, currency flexibility, and much greater Asian and China participation," HKEx Chief Executive Charles Li told a news briefing in Hong Kong.
 
 
PROGRESS ON CHINESE WAREHOUSES
 
Jones said the LME has moved forward in its long-standing goal of opening warehouses in top metals consumer China.
 
The LME has sought for many years to set up delivery networks in China to grow its business, but Chinese regulators have not approved the LME opening metals depots there.
 
"There's considerable progress and discussions going on all the time, we had some in fact the last few weeks," Jones said.
 
The LME would like to work with the Shanghai Exchange, which also trades base metals such as copper and aluminium, and already has a warehouse network, he added.
 
The LME, in setting its new fees, likely kept a close eye on remaining competitive with the CME Group .
 
Although the LME still controls the vast majority of industrial metals futures trading, its U.S. rival has been carving out a growing share of the global copper market with its Comex contract and in May launched a new aluminium contract in a big push to grab some of London's $51 billion market for the metal. 
 
A fund manager had told Reuters that the fees he was charged for trading on the CME were about 73 percent higher than the old LME fees.
 
"It's only logical now that you have to increase fees to be more in line with other exchanges that are for profit. It's still very competitive," said Robin Bhar, analyst at Societe Generale in London.
 
Before the LME's sale in December 2012, it was owned by the banks and brokers that used it and therefore trading fees were kept very low for members.
 
HKEx promised when it was bidding for the LME that it would freeze the low fees during an initial period, but the moratorium expires in January.

London Metal Exchange, eyeing CME, seeks big jump in trade fees

London Metal Exchange, eyeing CME, seeks big jump in trade fees
* LME to publish 2015 fee schedule on Monday
* Owner HKEx to boost fees to make takeover profitable
* LME fees 73 pct lower than rival CME - fund manager
The London Metal Exchange (LME), looking to boost profits, has scope for a significant hike to its trading fees whilst remaining competitive with arch U.S. rival CME Group .
The LME had warned of hefty increases when it publishes its new fees schedule for 2015 on Monday, but has kept the details under wraps.
The move will be another key step by the LME's owner, Hong Kong Exchanges and Clearing Ltd., to wring profits from its pricey $2.2 billion takeover of the world's biggest industrial metals market.
Before the LME's sale in December 2012, it was owned by the banks and brokers that used it and therefore trading fees were kept very low for members.
HKEx promised when it was bidding for the LME that it would freeze the low fees during an initial period, but the moratorium will expire in January.
Executives have been preparing the ground for a hefty increase, including HKEx Chief Executive Charles Li at a results presentation last month.
"The market knows and I don't think the market is going to be that happy about it," he said. "I can't tell you whether that's going to be a 20 percent increase, 30 percent increase or 50 percent increase..."

RIVAL CME
The LME, in setting the fees, is likely to keep a close eye on remaining competitive with the CME.
Although the LME still controls the vast majority of industrial metals futures trading, its U.S. rival has been carving out a growing share of the global copper market with its Comex contract and in May launched a new aluminium contract in a big push to grab some of London's $51 billion market for the metal. 
But due to the legacy of low fees, the LME has broad scope to boost revenue from that area and still remain competitive.
Exchange fee schedules are complicated, but one fund manager said the gap was huge between the fees he is charged for trading metals on the two rival markets.
Comex trading fees come in at an equivalent 73 percent higher than the LME, not including clearing fees, he said.
That would mean that the LME could increase fees by 50 percent and remain cheaper than its U.S. rival.
The LME declined to comment on how its fees compare with the CME.
Brokers say any fee hike will be difficult since the cost of trading has already soared due to additional costs from new regulations.
"This is a tough business to remain in," said an executive at a major LME broker, who said a rise in margin requirements and clearing costs was already hurting profits.
An executive at a major bank that trades commodities said he reckoned that total costs for trading on the LME could triple.
Initial grumbling would be expected, but users would have to accept the hikes, said analyst Robin Bhar at Societe Generale.
"At the end of the day people have to trade, consumers and producers have to hedge, so they will probably have to swallow those charges," he said.
"If the LME is still seen as competitive against other exchanges, then one could argue that they've been too low in the past."

Positive Zinc Outlook Not Necessarily a Sure Thing

Positive Zinc Outlook Not Necessarily a Sure Thing
Zinc market participants have likely grown used to hearing positive predictions about the metal, but in a recent article Mineweb's Kip Keen takes a look at the flip side of the coin.
As quoted in the market news:
"For a zinc refresher I called up Jessica Fung, a BMO mining analyst with a head for base metals, to talk about her more conservative view of the zinc sector.
Let's dig into some of her research.
First zinc consumption. It will come as no surprise that China consumes a lot of the world's zinc. Of total consumption last year China gobbled up about 46 percent, or 6,063 kt.
But, and this is one of the key considerations, China, unlike in the case of say copper , produces a huge amount of its own zinc. Zinc mine supply in China back in 2000 accounted for about 20% of global mine supply. Now it accounts for about 37%, which underscores massive mine supply growth over the past decade and near-half in which it demand also soared.
Fung is of the mind that this will continue, with potential for consolidation in the zinc mining sector in China and, as she puts it, economies of scale to be realized.

Goldman Sachs Sees Aluminum Deficit to Lift Prices

Goldman Sachs Sees Aluminum Deficit to Lift Prices
 Goldman Sachs projects that LME aluminum price will rise from $ 1,869 per tonne in 2014 to $ 2,150 per tonne in 2017, citing that aluminum market will swing into deficit during the 2014-2017 period, news fund 123 reported on September 26. 

China to Import 45 Million wmt of Nickel Ore from the Philippines in 2014

China to Import 45 Million wmt of Nickel Ore from the Philippines in 2014
 Inbound shipments of nickel ore to China from the Philippines are expected to reach 45 million wet tonnes (wmt) in 2014, Shanghai Metals Market foresees.    The Philippines has become the leading supplier of laterite nickel ore to China after Indonesia introduced its export ban on unprocessed ore early this year.    Higher profit following strong price gains of nickel ore has encouraged a large number of mines in the Philippines to increase production or restart idled operations.

Lead Outlook: Rising Demand, Shrinking Supply Could Mean Higher Prices in 2014

Lead Outlook: Rising Demand, Shrinking Supply Could Mean Higher Prices in 2014
It's been a good year for lead , and 2014 looks promising for the metal as well.
Rising demand and shrinking supply of lead have analysts optimistic that about what investors can expect in 2014.
2013 market performance 

Over the course of 2013, demand for lead rose significantly worldwide due to the the recovery in the auto industry in the U.S., the world‘s second-biggest market for lead. The U.S. doubled its lead imports over the first six months of 2013, influencing the price of the metal on the London Metal Exchange to rise more than 13 percent between May and June of 2013. Reuters reports the global market for lead tends to be consistent and balanced, meaning this surge is cutting into stockpiles and moving the market toward a deficit.
The World Bureau of Metal Statistics found U.S. imports of refined lead grew to 50,000 tons a month on average between November 2012 and March 2013 – leading those five months to come in at almost double the amount of lead the U.S. typically imports in a year.
"(Consumption) is likely coming from the auto sector because we know that the big three in the U.S. are at full capacity," Joel Crane, an analyst at Morgan Stanley, told Reuters.
However, lead plant closures have forced automakers and other end users of the metal to seek other sources, including looking to Asia for lead. The U.S. imports most of its lead from Australia, according to the World Bureau of Metal Statistics, which has an impact on the supply of the metal in Asia. The exception to this is China, the world‘s biggest producer and consumer of refined lead, which does not tend to export the metal due to export duties.
"Because the market is so finely balanced, it just needs a little bit of stronger demand or a few production problems to actually see a few pockets of shortage emerge," analyst Neil Hawkes of consultancy CRU, told Reuters.
In addition to rising demand in the U.S., lead traders have been seeing an increase in business in India, where demand is high. The middle class uses back-up batteries to weather summer power cuts, and these require lead.
"We have been doing a lot of business into India for the last month and a half," a dealer told Reuters. "To all parts, Chennai, the eastern parts, largely consumed by the battery segment."
India demands near half a million tons of lead a year, representing 5 percent of world reserves. At Malaysian ports, the price for lead was typically $70 to $80 higher than on the L​ondon Metal Exchange in mid-year 2013.
Leading the pack into 2014
According to the International Lead and Zinc Study Group, the global refined lead market experienced a significant deficit in the first half of 2013. The inventories at the LME and the Shanghai Futures Exchange alike are low. Because of low supply and increasing demand, 2014 looks good for lead. The Wall Street Journal predicts lead supply will fall short of demand in 2014.
"The market looks a lot tighter in terms of balance this year and next year," Joseph Murphy, a senior analyst at Hermes Commodities, told the WSJ.
The price of lead tends to rise in the colder months, as low temperatures often cause car batteries to fail. Because of this, manufacturers want to be ready with enough batteries to replace those lost to the cold. For this reason, many commodities traders look to put their capital on lead toward the end of the year and the beginning of the next. The growing demand for cars, and hence for lead, in developing economies is also bolstering the metal‘s price.
Car sales are rising – in China, they rose 21 percent year-over-year in 2013, while they rose 12.7 percent in the U.S. and 5.4 percent in Europe, according to the WSJ. This is good news for lead, which looks to have a promising year ahead.
Business Standard published an article about the future of base metals in 2014 and asserts the tapering of the U.S. Federal Reserve‘s quantitative easing program and the economic growth in China both point to investment capital coming back to base metals in the year ahead. The publication expects higher prices in the coming year on lead and other base metals. It cites lead as the best-positioned of the base metals in 2014 as the forecast calls for global supply deficits throughout the year.

BMO sees Copper supply surplus of 411,000 tons in 2014

BMO sees Copper supply surplus of 411,000 tons in 2014
BMO Research looks for a copper supply surplus of 411,000 tons this year and a surplus of 623,000 in 2015.

BMO’s base-case copper forecast is for an oversupplied market through 2018, before it moves back into deficit in 2019. They also looks for supply surpluses of 711,000 in 2016, 595,000 in 2017 and 172,000 in 2018.

However, the surplus is likely to be relatively benign at only 3% of demand. As a result, BMO looks for the price to dip only to $2.90 a pound in 2016, which would be the 93rd percentile on the estimated 2016 cost curve. 

However, BMO Research also noted that the bearish sentiment toward copper is due to the fact that the copper market has not really been in surplus since 2003 -- financial crisis aside. 

Copper prices have declined from sitting above the cost curve for a number of years. The undersupplied base meals in the near term are expected to be nickel, aluminum and zinc ahead of copper.

Mine supply is forecast to increase to 21.9 million metric tons in 2016 from 17.9 million in 2013, a level of growth that has not occurred since 2004.

The key difference this time is that demand is unlikely to be on pace to absorb this level of mine supply near term. 

“China remains the largest consumer globally, and while there is room to grow based on per capita figures, the pace is likely to slow as heavy industry overcapacity is reined in. Longer term, however, Asia and Latam are expected to drive the next up cycle,” BMO concluded.

LME Copper eyes a week-long Chinese holiday

LME Copper eyes a week-long Chinese holiday
Trading in Chinese markets will be suspended during October 1-7 for the National Day holiday. 

What are major factors analysts believe to affect LME copper prices during the week-long Chinese holiday?

History shows LME copper generally performed well in the holiday periods for the past seven years, except for 2008 and 2013. The red metal tumbled in early October in 2008 due to the global financial turmoil and slumped for the same period last year due to the Federal government shutdown.

As for the remaining five years, the gains in LME copper were mostly driven by a weaker US dollar and strong economic data, particularly manufacturing and hiring figures, which were the main causes behind both a 12.64% plunge in 2008’s holiday and the over 4% climb in 2011.

Besides, analysts noted that copper prices in China usually tracked the LME copper price trends during the holiday after the SHFE restarted.

This year, the US dollar index has jumped above 85 to an over four-year high, and the US economy is still recovering steadily, compared with China’s slowdown and continued gloominess in Europe.

The US CPI, September manufacturing PMI and non-farm payrolls are slated for release during China’s early-October break. These economic performance indicators will impact movements of the dollar, in turn, exerting influence on LME copper prices.

In addition, the European Central Bank (ECB) will decide whether to roll out further accommodative measures at its policy meeting scheduled for October 2, which is also expected to affect LME copper prices.

"The Ingredients Of A Market Crash": John Hussman Explains "Why Take The Concerns Of A Permabear Seriously"

Why take the concerns of a “permabear” seriously?
The inclination to ignore these concerns is understandable based on the fact that I’ve proved fallible in the half-cycle advance since 2009. That’s fine – my objective isn’t to convert anyone to our own investment discipline or encourage them to abandon their own. Somebody will have to hold equities through the completion of this cycle, and it’s best to include those who have thoughtfully chosen to accept the historical risks of a passive investment strategy, and those who have at least evaluated our concerns and dismissed them. The reality is that my reputation as a “permabear” is entirely an artifact of two specific elements since the 2009 low, but that miscasting may not become completely clear until we observe a material retreat in valuations coupled with an early improvement in market internals.
For those who understand and appreciate our work, I discuss these two elements frequently because a) I think it’s important to be open about those challenges and to detail how we’ve addressed them, and b) it’s becoming urgent to clarify why we view present conditions as extraordinarily hostile, and to distinguish these conditions from others that – despite an increasingly overvalued market – our current methods would have embraced or at least tolerated more than we demonstrated in real-time.
For us, the half-cycle since 2009 has involved the resolution of two challenges.
The first: despite anticipating the 2007-2009 collapse, the timing of my decision to stress-test our methods against Depression-era data – and to make our methods robust to those outcomes – could hardly have been worse. In the interim of that “two data sets” uncertainty, we missed what in hindsight was the best opportunity in this cycle to respond to a material retreat in valuations coupled with early improvement in market internals (a constructive opportunity that we eagerly embraced in prior market cycles, andattempted to embrace in late-2008 after a 40% market plunge).
The second: I underestimated the extent to which yield-seeking speculation in response to quantitative easing would so persistently defer a key historical regularity: that extreme overvalued, overbought, overbullish market conditions typically end with tragic market losses. Those extremes have now been stretched, uncorrected, for the longest span in history, including the late-1990’s bubble advance. My impression is that the completion of the present market cycle will only be worse as a result.
The ensemble approach we introduced in 2010 resolved our “two-data sets” challenge, and was moreeffective in classifying market return/risk profiles than the methods that gave us a nice reputation by 2009, but our value-conscious focus gave us a tendency to exit overvalued bubble periods too early. During the late-1990’s, observing that stock prices were persistently advancing despite historically overvalued conditions, we introduced a set of “overlays” that restricted our defensive response to overvalued conditions, provided that certain observable supports were present. These generally related to an aspect of market action that I called trend uniformity. In the speculative advance of recent years, we ultimately re-introduced variants of those overlays to our present ensemble approach.
As I observed in June, the adaptations we’ve made in recent years have addressed both of these challenges. See the section “Lessons from the Recent Half-Cycle” in Formula for Market Extremes to understand the nature of these adaptations. When we examine the cumulative progress of the stock market in periods we classify as having flat or negative return/risk profiles (and that also survive the overlays), the chart looks like the bumpy downward slope of a mountain. Present conditions are worse, because they feature both a negative estimated return/risk profile and negative trend uniformity on our measures. The cumulative progress of the stock market under these conditions – representing less than 5% of history – looks like the stairway to hell, and captures periods of negative market returns even during the bull market period since 2009. The chart below shows cumulative S&P 500 total returns (log scale) restricted to this subset of history. The flat sideways sections are periods where other return/risk classifications were in effect than what we observe today.
Though we’ve validated our present methods of classifying market return/risk profiles in both post-war and Depression-era data, in “holdout” validation data, and even in data since 2009, there’s no assurance they’ll be effective in the current or future instances. As value-conscious, historically-informed investors, we remain convinced that the lessons of history are still relevant. Our efforts have centered on embodying those lessons in our discipline.
While all of these considerations are incorporated into our approach, we’ve had little opportunity to demonstrate the impact we expect over the course of the market cycle. Applied to a century of historical market evidence, including data from the present market cycle, we’re convinced that the adaptations we’ve made have addressed what we needed to address.
Our concerns at present mirror those that we expressed at the 2000 and 2007 peaks, as we again observe an overvalued, overbought, overbullish extreme that is now coupled with a clear deterioration in market internals, a widening of credit spreads, and a breakdown in our measures of trend uniformity. These negative conditions survive every restriction that we’ve implemented in recent years that might have reduced our defensiveness at various points in this cycle.
My sense is that a great many speculators are simultaneously imagining some clear exit signal, or the ability to act on some “tight stop” now that the primary psychological driver of speculation – Federal Reserve expansion of quantitative easing – is coming to a close. Recall 1929, 1937, 1973, 1987, 2001, and 2008. History teaches that the market doesn’t offer executable opportunities for an entire speculative crowd to exit with paper profits intact. Hence what we call the Exit Rule for Bubbles: you only get out if you panic before everyone else does.
Meanwhile, with European Central Bank assets no greater than they were in 2008, and more fiscally stable European countries quite unwilling to finance the deficits of unstable ones, the ECB has far more barriers to sustained large-scale action than Draghi’s words reveal. Moreover, to the extent that the ECB intends to buy asset-backed securities (ABS), which have a relatively small market in Europe, the primary effect (much like the mortgage bubble in the U.S.) will be to encourage the creation of very complex, financially engineered, and ultimately really junky ABS securities that can be foisted on the public balance sheet. Watch. In any event, even if such monetary interventions continue indefinitely, I have no doubt that we’ll have the opportunity to respond more constructively at points where we don’t observe upward pressure on risk-premiums and extensive deterioration in market internals.
I should be clear that market peaks often go through several months of top formation, so the near-term remains uncertain. Still, it has become urgent for investors to carefully examine all risk exposures. When extreme valuations on historically reliable measures, lopsided bullishness, and compressed risk premiums are joined by deteriorating market internals, widening credit spreads, and a breakdown in trend uniformity, it’s advisable to make certain that the long position you have is the long position you want over the remainder of the market cycle. As conditions stand, we currently observe the ingredients of a market crash.

Major Sell Program Trips 50-DMA, Sends Stocks Sliding

A "huge" institutional sell order, covering almost 200 individual stocks, is rumored to have been responsible for getting this morning's weakness across stocks going as equity indices catch down to bonds and credit. The S&P 500 broke key support at its 50-day moving-average (for first time in 2 months) and is back at 6 week lows. The Russell 2000 is now down 4.25% from the FOMC meeting last week...
S&P 500 cash breaks key technical
Major Sell Program Trips 50-DMA, Sends Stocks Sliding

What Wall Street Thinks About Today's Selloff

Aside from Russian threatsweaker-than-expected Durable Goodsand #Bendgate, here are nine other reasons for today's sell-off...

Via FBN Securities' Michael Naso,
Thoughts from the Options Desk and the Technical Desk about this Mornings Action

Month End:  It’s the last day for underperforming or performing hedge funds to get names off the books so they don’t show up in quarterly report which equates to selling pressure.

Position Closing: Chatter that there was and maybe still is a massive asset allocator selling equities and buying bonds to rebalance books as the equity move made them a bit too long equities which again equates to selling pressure.

Holiday: There is very little liquidity because of the Jewish holiday making any selling pressure magnified however as of noon the S&P 500 is running +20% vs its 30 day average volume.
High Yield: Many High Yield traders have been trying to sell HY and IG bonds today with quarter end upon us, much like they did at the end of the June Qtr. Given the lack of liquidity and participants today, HY sellers have no bids to hit, so they have turned to selling equities and underlying names to hedge their positions or de-risk. Tuesday the slope of the BofA Us High Yield Master II OAS 200 dma turned higher for the first time since May 2012.  The changing of trend has forewarned of equity markets largest reversals since inception of this HY index.

SKEW: SPX Skew is at some of its highest levels in years, showing traders are running for out of the money puts, usually spike skew is closer to a bottom then a top.

Volatility: VIX is up 18%, its biggest 1 day % move since July 31st.

TRIN: Highest intraday TRIN reading since Feb 3rd '14, which is an indication of material selling pressure (the Feb 3 spike marked the years low).

Sentiment: Bears in the AAII survey jump to a 7 week high, majority of the new Bears moved from the Neutral camp rather then from the Bullish camp.

S&P 500 Levels of Support: 1954.50 ( 100 dma), 1946-44, 1936

Chart Below Showing High Yield putting pressure on Small caps which in turn is applying pressure to the S&P 500
What Wall Street Thinks About Today's Selloff

Miracle Panic-Buyer Lifts Stocks Green From 50DMA

Do you believe in miracles? With death-crosses crossing, Hindenburgs Omening, bonds and credit diverging, breadth deteriorating, stocks on the verge of the worst run of thge year, and the S&P 500 testing the crucial 50-day moving average... it should be no surprise that a combination of VIX-slamming, USDJPY-ramping, PBOC-firing, Fed-speaking sent stocks to their biggest gains in 7-weeks after the worst selling in 5 weeks (and people think the BoJ is the only one buying stocks). Treasury yields rose but nothing like the exuberance in stocks. HY credit markets deteriorated notably (bounced with stocks but notably less so). The USD surged (apparently on PBOC rumors) early (+0.3% on the week). Gold & Silver dropped, copper rose modestly but WTI oil prices exploded higher with stocks' exuberance (and Benghazi headlines). VIX was banged from over 15 to under 13.5. S&P 500 2,000 (1,999.79 achieved) and getting back to green post-FOMC was all that mattered today - and Mission Accomplished... before a slightly weak close.

Dead cat bounce? Perfect 50% retrace of the drop...
Miracle Panic-Buyer Lifts Stocks Green From 50DMA

and The S&P 500 desparately wanted 2,000 (but failed 1999.79 highs)
Miracle Panic-Buyer Lifts Stocks Green From 50DMA

WTI outperformed Brent - spread back to almost $4
Miracle Panic-Buyer Lifts Stocks Green From 50DMA

India’s top court cancels over 200 coal licences

India’s top court cancels over 200 coal licences
India's Supreme Court has cancelled 214 of the 218 government permits for coal mines allocated since 1993 after the licensing process was deemed illegal, in a move that adds uncertainty beyond the struggling sector to the heart of Asia's third-largest economy.
"The court has cancelled all the allocations except four," Attorney General Mukul Rohtagi told reporters on Wednesday outside the court, Business Standard reports.
Last month the same court ruledthe country's decades-old method of granting coal mining concessions was illegal and arbitrary
Last month the same court ruled the country's decades-old method of granting coal mining concessions was illegal and arbitrary, putting investments worth billions of dollars at risk.
The court decision took effect immediately for the 172 mines that weren't in production. It also ignored requests from the federal government to exempt about 40 coal blocks that had either started production or were near it.
The ruling sent shares of Jindal Steel and Power Limited, Hindalco Industries Limited and Tata Power Co Limited sharply lower.
The firms have already spent heavily on steel and power plants based around the coal blocks.
As companies have waited to learn the fate of the coal-mining rights, India has faced an acute shortage of coal, which fuels about three-fifths of its power needs.
The country is the world's third-largest producer of coal, behind China and the U.S. Yet it relies heavily on imports because of mismanagement and an onerous bureaucracy in coal exploration, production and power generation. As a result, nearly a quarter of India's 1.2 billion people have no electricity, according to the World Bank.